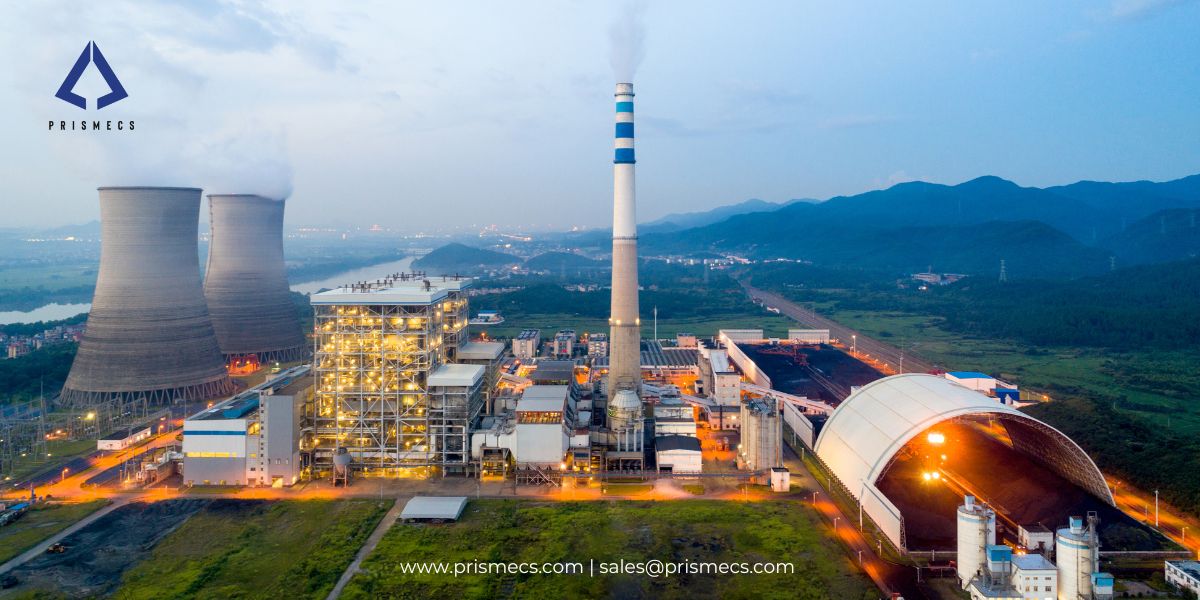
Most analysis of whether to generate your own power uses the wrong comparison.
A merchant power plant is judged against the wholesale price and its levelized cost. A captive plant is judged against your avoided retail cost, which includes the energy charge, the demand charge and every rider on your bill. That number is often two to three times the wholesale price, and it is why onsite generation can be economic at load factors no merchant plant could ever justify.
Get that comparison right and the rest follows: sizing to the thermal load rather than the electrical, choosing a cooling system that fits your water position, and negotiating the standby charge before you commission rather than after.
This guide covers the decision, the arithmetic, and the four things that most often make a captive project underperform its business case.
Should You Generate Your Own Power?
Four conditions make captive generation worth evaluating, and you generally need at least two of them.
A high load factor. Load factor is average demand divided by peak demand over a period. A facility running 8,000 hours a year at steady load spreads fixed costs across far more output than one running two shifts.
A coincident thermal load. If you need steam, hot water or process heat as well as electricity, combined heat and power changes the economics fundamentally, because you are buying one fuel input and getting two outputs.
High delivered electricity cost. Retail rates including demand charges vary by more than a factor of three across US markets and far more internationally.
A reliability requirement the grid does not meet. Where an outage stops production, the cost of unserved energy dwarfs the tariff comparison.
What the grid position is doing
Grid supply is not standing still. In 2025, renewables reached 33.8 percent of global electricity and overtook coal for the first time in over 100 years, with coal falling below a third of global generation and fossil fuels supplying 54.7 percent of the total. Fossil generation fell 0.2 percent, the first decline not caused by an economic shock.
That matters to a captive decision in two ways. Grid carbon intensity is falling, which weakens the emissions argument for self-generation in some markets. And interconnection queues are lengthening, which strengthens the availability argument in others.
Where the question is whether to extend the life of an existing onsite plant rather than build new, see our guide to brownfield power generation decisions.
What Captive Power Is
A captive power plant is a generating facility owned by an industrial or commercial user that consumes the electricity itself, rather than selling it.
The defining feature is who consumes the output. An independent power producer generates for sale to others. A captive power producer generates for its own use, though many also export surplus.
Behind-the-meter describes generation connected on the customer's side of the utility revenue meter, so its output reduces measured consumption rather than being sold into the grid.
The category has changed. A captive power plant is no longer a backup diesel generator. Modern captive plants are multi-megawatt facilities, frequently using combined heat and power to achieve total efficiencies above 80 percent, designed to run continuously as the primary supply.
Captive versus independent power production
For the regulatory framework that applies when you sell power rather than consume it, see our guide to independent power producers.
Market direction
The captive power generation market was valued at approximately $47.09 billion in 2024 and is projected to reach $70.64 billion by 2033, a compound annual growth rate of about 5.2 percent, driven by industrial energy demand, regulatory incentives and efficiency technology adoption. Note that this figure describes the captive segment specifically, not the global power generation market, which is orders of magnitude larger.
The Comparison That Actually Decides It
Compare your delivered cost of self-generation against your avoided retail cost, not against the wholesale price or a published LCOE.
Avoided cost here means everything you stop paying the utility for each kilowatt-hour you generate yourself. That is more than the energy rate.
What your avoided cost actually includes
The energy charge, in cents per kWh consumed.
The demand charge, billed on your peak demand in a period, commonly in dollars per kW per month. On many industrial tariffs this is 30 to 50 percent of the total bill, and it is charged on your highest 15 or 30-minute interval regardless of how briefly it occurred.
Riders, surcharges and adjustments, including transmission, distribution, capacity and fuel cost adjustments.
Taxes applied to the whole.
Take your total annual electricity spend and divide by total kWh consumed. That blended number, not the energy rate, is what self-generation competes against.
What your self-generation cost includes
Fuel, calculated as heat rate multiplied by delivered fuel price. Fixed O&M. Variable O&M. Capital recovery. Standby or backup charges from the utility. And the value of any thermal output you displace, which is a credit rather than a cost.
Why load factor decides so much
Capital and fixed O&M do not change with output. A plant running 8,000 hours a year spreads them across roughly four times the generation of one running 2,000 hours. Two identical plants with identical capital cost can have delivered costs differing by a factor of three purely on load factor.
This is the single reason captive projects fail their business case most often: the plant was modelled at a load factor the host's production schedule does not actually support.
If gas prices rise
Fuel is the largest variable cost and it moves. Model the comparison across a range rather than at a single price, and identify the gas price at which self-generation stops beating the tariff. If that crossover sits inside a plausible range, the project carries fuel price risk that should be hedged or accepted explicitly.
Solar captive as an alternative
Solar has no fuel cost and produces on a shape you do not control. Where your load is daytime-weighted and your demand charge is set during daylight hours, it can reduce both energy and demand charges. Where your peak is in the evening, it reduces energy charges and leaves the demand charge largely untouched. For storage to reshape that, see our guide to battery energy storage systems.
If the answer is no
Negotiating a better tariff, shifting load off peak, or improving power factor are all cheaper than building a power plant and should be tested first. A feasibility study that does not include "do nothing and renegotiate" as an option is not a feasibility study.
CHP and the Thermal Load
Combined heat and power generates electricity and useful thermal energy from a single fuel input, reaching total efficiencies of 75 to 85 percent against roughly one-third for grid electricity delivered alone.
In centralised generation, roughly two-thirds of the fuel's energy is lost as waste heat through cooling towers, exhaust stacks and heat exchangers. A CHP system captures that heat at the point of use.
Cogeneration is another name for the same thing. Trigeneration adds an absorption chiller, which uses heat rather than electricity to drive cooling, producing electricity, heating and cooling from one fuel input.
The payback
The EPA's CHP Partnership documents average paybacks of 5 to 7 years across commercial and industrial CHP installations. Well-matched facilities do better. A commercial laundry consuming 500 kW of electricity alongside 8,000 MBtu per month of natural gas for dryers and water heating can reach 4 to 6 year paybacks on a correctly sized system.
Where CHP fits best
Facilities with a steady, year-round thermal load alongside a steady electrical load. Breweries, dairy processors, bakeries, meat processors and commercial laundries all share that profile. So do hospitals, campuses, and data centres where absorption chilling can convert thermal output into cooling.
The common factor is not industry. It is a thermal load that does not disappear when the weather changes.
If the thermal load is seasonal or disappears
CHP economics collapse without a heat sink. A system sized around a winter heating load will spend summer dumping heat, which is the same as running a less efficient power-only plant while having paid for the heat recovery equipment.
Where the thermal load is seasonal, either size to the summer minimum, add a use for the surplus such as absorption chilling, or accept power-only generation. A CHP system with nowhere to put its heat is not a CHP system.
Sizing: The Error That Kills the Economics
Size a CHP plant to the thermal load, not the electrical load, because heat you cannot use is fuel you wasted.
Oversizing for electrical output creates excess heat that cannot be used, which undermines system economics directly. A plant sized to meet peak electrical demand will produce far more heat than the host needs for most of the year.
Power-to-heat ratio is the ratio of electrical output to useful thermal output for a given technology. Reciprocating engines typically produce proportionally more electricity per unit of heat than steam turbines; gas turbines sit between them. Match the technology's ratio to your facility's ratio rather than the other way round.
The sizing sequence
Profile both loads. Electrical and thermal, on interval data across a full year, not on nameplate or on a monthly bill.
Find the coincident minimum. The level of thermal demand that is present nearly all the time is the base a CHP plant should serve.
Size to that, then check the electrical output. Whatever electricity the thermally sized plant produces is what you self-generate. The balance comes from the grid.
Test the turndown. How far the unit can back off while staying efficient determines how well it follows a variable load.
If your load profile is spiky
Modular capacity beats a single large unit. Multiple smaller units allow you to run at high load factor on fewer machines and shut the rest down, rather than running one large machine inefficiently at part load.
That configuration also gives redundancy, which matters for the reason covered below.
For technology selection between reciprocating engines and gas turbines on heat rate and duty cycle, see our guide to power generation systems compared.
Water and Cooling
Cooling system choice moves plant water consumption from roughly 600 gallons per megawatt-hour to effectively zero, and in water-constrained locations it decides where a plant can be built at all.
A power plant's water use is set by its cooling system first and its fuel second.
Across the existing US thermoelectric fleet, once-through cooling accounts for approximately 43 percent of cooling systems and recirculating towers approximately 53 percent.
The trade-off to understand
Once-through cooling withdraws enormous volumes and consumes very little, returning nearly all of it warmer. Wet recirculating towers withdraw far less and consume far more, because the cooling happens by evaporation.
Which matters depends on your constraint. In a water-scarce region, consumption is the binding number. Where the constraint is a permit limit on withdrawal or thermal discharge, the other column governs.
Dry cooling and its cost
Dry cooling blows ambient air across the condenser tubes and uses no cooling water. It carries two penalties: higher capital cost, and reduced output on hot afternoons precisely when electricity is most valuable and, for a captive plant, when your host's cooling load is highest.
Where water is unavailable or permitting is constrained, that penalty is usually worth accepting. Where water is available, it usually is not.
If you add carbon capture
Amine-based post-combustion capture roughly doubles water use for a wet-cooled plant, and capturing 90 percent of CO2 from a coal plant increases plant water use by 20 to 50 percent. Any capture retrofit should be assessed for water before it is assessed for carbon.
Efficiency Metrics That Actually Mean Something
Three metrics govern a generating plant's performance, and an efficiency claim without a named standard behind it cannot be enforced.
Heat rate is the fuel energy required per unit of electrical output, expressed in Btu/kWh. Lower is better. It is the single number that converts fuel price into cost per MWh.
Capacity factor is actual generation divided by generation at continuous full output over the same period. It determines how far fixed costs are spread.
Availability is the proportion of a period the plant was capable of generating. For a captive plant serving production, this is the metric that matters most.
Naming the standard
ASME PTC 46, Performance Test Code on Overall Plant Performance, governs whole-plant net output and heat rate testing. ASME PTC 22, Performance Test Code on Gas Turbines, covers gas turbine output and heat rate.
IEEE Std 762, Definitions for Reporting Electric Generating Unit Reliability, Availability, and Productivity, is the terminology standard that makes availability figures comparable between parties.
Where performance is contractual, name the code, agree the correction curves and the measurement uncertainty before award, and define the exclusions for availability. A guarantee whose test method is agreed after commissioning is a negotiation, not a guarantee.
Degradation
Heat rate degrades with operating hours and with fouling. Compressor washing, filter maintenance and combustion tuning recover part of it, and a plant that has drifted 3 percent on heat rate is paying 3 percent more for fuel every hour. Trend it against a corrected baseline, not against raw readings.
Grid Interaction, Standby Charges and Permitting
Even a fully self-supplying captive plant stays connected to the grid, and what the utility charges for that connection can materially change the payback.
Standby charges
A standby or backup charge is a utility tariff for maintaining capacity to serve you when your own generation is unavailable. It is typically billed on demand, not energy, which means you pay it whether or not you draw power.
This is the most commonly overlooked cost in a captive power business case. A project modelled without it, then commissioned onto a tariff that includes it, can lose a large share of its projected saving.
Establish the applicable tariff, the charge basis and any exemptions before the feasibility study concludes. Some jurisdictions exempt CHP or high-efficiency generation; others do not.
Exporting surplus
If you export, the project changes character. Net metering arrangements, where available, credit exported energy against consumption, and rules vary substantially by jurisdiction and by customer class. Exporting also brings interconnection requirements and, above certain thresholds, wholesale market regulation.
IEEE Std 1547-2018, Standard for Interconnection and Interoperability of Distributed Energy Resources with Associated Electric Power Systems Interfaces, governs the technical requirements, with IEEE Std 1547.1-2020 defining conformance test procedures. A non-export configuration avoids much of that scope and should be chosen deliberately.
Islanding
Islanding is operating disconnected from the utility, supplying the host alone. Intentional islanding requires transfer equipment, protection and control capable of separating cleanly and resynchronising. Unintentional islanding is a safety hazard and is what anti-islanding protection exists to prevent.
If reliability is a driver, confirm that the design supports intentional islanding. Many grid-parallel installations do not, and they shut down in the outage they were bought to survive.
Emissions and standards
Adding combustion capacity triggers air permitting, and the applicable standard depends on size and technology. For stationary combustion turbines in the US, 40 CFR Part 60 Subpart KKKKa applies to units constructed, modified or reconstructed after 13 December 2024. Where emergency or standby generators are involved, NFPA 70 Article 700 and NFPA 110 govern the electrical and system requirements.
Self-generation also moves emissions from Scope 2, purchased electricity, to Scope 1, direct combustion. Whether that is a net reduction depends on your grid's carbon intensity and on whether you are recovering heat.
What Stops a Captive Plant
Most captive installations have little or no redundancy, which means a single machine failure stops the plant and, in many configurations, the production it serves.
This is the risk that distinguishes a captive plant from a merchant one. A merchant generator loses revenue. A captive generator loses production.
Designing for it
Decide the consequence of an outage before selecting the configuration. If losing power stops production, N+1 on the prime mover, or retained grid supply sized to carry critical load, is not optional.
Modular capacity provides redundancy as a by-product of good sizing, which is one more reason to prefer multiple smaller units over a single large one on a variable load.
Spares and support
Hold critical spares where the resupply time exceeds what your production can absorb, and establish a response commitment with evidence rather than an assertion. For PM regimes on the rotating equipment involved, see our rotating equipment field guide. For planning the outages that protect availability, see our outage planning guide.
Staffing and operations
A captive plant needs an operating and maintenance capability the facility did not previously have. That is a role and a competency, not a line on a facilities budget. For what an operations scope actually contains, see our guide to plant operations and maintenance.
Insurance
Machinery breakdown and business interruption cover price on equipment type, protection systems, maintenance regime and redundancy. A single-unit captive plant serving production is a different underwriting proposition from a redundant one, and the change should be disclosed at design rather than discovered at claim.
The Feasibility Sequence
Assess a captive power project in the order that respects lead time and kills bad options early.
Step one, profile the loads. Electrical and thermal, on interval data across a full year. Nameplate and monthly bills are not sufficient, and this step alone eliminates a meaningful share of projects.
Step two, calculate avoided cost. Total annual electricity spend divided by total kWh, with the demand charge component identified separately.
Step three, test the tariff alternatives. Renegotiation, load shifting and power factor correction, before any capital option.
Step four, size to the thermal load where CHP is in scope, then establish the resulting electrical output.
Step five, confirm the constraints. Water availability and cooling choice, air permitting, space, fuel supply, and the utility standby tariff.
Step six, model across a fuel price range and identify the crossover point.
Step seven, decide ownership. Own, lease, or an energy-as-a-service arrangement where a third party owns and operates and you buy the output. Ownership determines capital treatment, who carries O&M and who holds the emissions.
Step eight, procure. Equipment lead times are frequently the schedule driver. See our guide to the industrial procurement process. Where power is needed before the permanent plant is ready, see our guide to temporary and mobile power.
Timeline
A feasibility study runs typically 6 to 12 weeks. Permitting and utility engagement run in parallel and often govern. Equipment delivery then sets the construction start. Expect 18 to 30 months from decision to commercial operation for a multi-megawatt installation, longer where permitting is contested or equipment lead times are extended.
What to require from an EPC partner
Delivered projects of comparable scale and configuration, with hosts who will take a call. Hazardous area and permitting experience where applicable. A stated schedule to energisation with assumptions visible. And clarity on whether they will operate the plant afterwards and on what availability terms.
Tax and accounting
Capital expenditure sets a depreciation basis and a recorded useful life, and available incentives vary by technology and jurisdiction and change. Confirm both with your finance team and tax adviser before the capital request, because they affect the return calculation directly.
Where formal energy management is required, ISO 50001, Energy management systems, provides the management system standard.
For plant capital cost by technology, LCOE and the wider financing picture, see our guide to thermal power plant cost.
How the Captive Decision Varies by Sector
The arithmetic is constant. Which input dominates changes with the facility.
Manufacturing
High load factor and often a process heat requirement, which is the classic CHP profile. Demand charges are usually a large share of the bill, so peak reduction carries significant value independently of energy cost.
Food, beverage and pharmaceutical
Steady year-round thermal load for process heat, cleaning and sterilisation. Breweries, dairy processors, bakeries and meat processors are documented strong CHP fits. Steam quality and reliability requirements are higher than in general manufacturing.
Data centres
The constraint is time to power rather than cost per MWh, and absorption chilling can convert CHP thermal output into cooling, which is a genuine thermal sink where one otherwise does not exist. Redundancy requirements are far stricter than in general industry.
Cement, metals and minerals
Very high, continuous electrical load concentrated in a few large drives, with waste heat available from process exhaust. Waste heat recovery is frequently more attractive than new combustion capacity.
Hospitals and campuses
Steady thermal and electrical loads, a genuine reliability requirement, and a regulatory framework for emergency power that already exists. CHP and emergency generation are separate systems serving separate purposes and should not be conflated.
Remote operations
Where there is no grid, the comparison is against delivered diesel rather than a tariff, and the bar is much higher. Hybrid configurations combining generation with solar and storage reduce fuel consumption materially.
Outside the United States
The engineering is unchanged. What differs is the tariff structure, the availability and cost of grid supply, local content and permitting requirements, and whether captive generation is encouraged or restricted. In several markets, unreliable grid supply makes captive power the default rather than the exception.
What Prismecs Does
Prismecs delivers onsite and distributed generation for industrial facilities, and operates the assets afterwards.
Delivered project scope includes eight TM2500 dual-fuel units totalling 260 MW at Birr, Switzerland, online in six months with a new 220 kV interconnection; four TM2500 units totalling 110 MW at Duqm, Oman with resident O&M crews, CMMS and parts support; an LM2500XPRESS plant at Miaoli, Taiwan delivered in ten months; three LM6000PC units adding 150 MW of fast-start reserve; and DC-coupled battery energy storage for solar and hybrid projects including a 4 MW PV retrofit, a 7 MW / 28 MWh system and a 9 MW system.
Prismecs is OEM-agnostic, which matters on a captive project, because the party recommending the technology is not the party selling one manufacturer's equipment.
Apply this article's criteria to any partner, including us. Ask what load factor and avoided cost their model assumes. Ask whether they sized to the thermal load. Ask what standby tariff they have allowed for. Ask what ASME code the heat rate guarantee will be tested under.
To request a captive power feasibility and avoided-cost assessment, send twelve months of interval electricity data, your thermal load profile, your current tariff schedule and your site location to sales@prismecs.com or call +1 (888) 774-7632. We return an avoided-cost calculation, a sizing recommendation and the constraints that would govern.
Frequently Asked Questions
What is a captive power plant?
A captive power plant is a generating facility owned by an industrial or commercial user that consumes the electricity itself rather than selling it. The defining feature is who consumes the output. Modern captive plants are multi-megawatt facilities, frequently using combined heat and power to achieve total efficiencies above 80 percent, designed to run continuously as primary supply rather than as backup.
What is the difference between a captive power plant and an IPP?
Ownership and who consumes the electricity. A captive power producer generates for its own facility and is evaluated against avoided retail cost. An independent power producer generates for sale to utilities, businesses or the market, and is evaluated against wholesale price, a PPA or LCOE. An IPP also carries regulatory status and market registration obligations that a non-exporting captive plant generally avoids.
How do I know whether to generate my own power?
Compare your delivered cost of self-generation against your avoided retail cost, meaning total annual electricity spend divided by total kWh consumed, including energy charges, demand charges, riders and taxes. Four conditions make it worth evaluating: a high load factor, a coincident thermal load, high delivered electricity cost, and a reliability requirement the grid does not meet. You generally need at least two.
Why is avoided cost the right comparison rather than LCOE?
Because a captive plant displaces retail electricity, not wholesale. Your blended retail rate including demand charges is often two to three times the wholesale price, which is why onsite generation can be economic at load factors no merchant plant could justify. Comparing a captive project against wholesale price or a published LCOE systematically understates its value.
What is a demand charge and why does it matter?
A demand charge is billed on your peak demand in a period, commonly in dollars per kW per month, and it is charged on your highest 15 or 30-minute interval regardless of how briefly it occurred. On many industrial tariffs it represents 30 to 50 percent of the total bill. Because it is independent of energy consumed, reducing peak demand carries value separate from reducing consumption.
What efficiency does CHP achieve?
Combined heat and power typically achieves 75 to 85 percent total system efficiency by generating electricity and useful thermal energy from a single fuel input, against roughly one-third for centralised generation delivered as electricity alone. In centralised generation, roughly two-thirds of the fuel's energy is lost as waste heat through cooling towers, exhaust stacks and heat exchangers. CHP captures that heat at the point of use.
What payback should I expect on CHP?
The EPA's CHP Partnership documents average paybacks of 5 to 7 years across commercial and industrial installations. Well-matched facilities do better. A commercial laundry consuming 500 kW of electricity alongside 8,000 MBtu per month of natural gas for dryers and water heating can reach 4 to 6 year paybacks on a correctly sized system. Payback depends far more on load match than on equipment selection.
Should I size a CHP plant to the electrical or thermal load?
The thermal load. Oversizing for electrical output creates excess heat that cannot be used, which undermines the economics directly. Profile both loads on interval data across a full year, find the level of thermal demand present nearly all the time, size to that, and take whatever electrical output results. The balance of your electricity comes from the grid.
What happens if my thermal load is seasonal?
CHP economics collapse without a heat sink. A system sized around a winter heating load spends summer dumping heat, which is equivalent to running a less efficient power-only plant while having paid for heat recovery equipment. Either size to the summer minimum, add a use for the surplus such as absorption chilling, or accept power-only generation. A CHP system with nowhere to put its heat is not a CHP system.
How much water does a power plant consume?
It depends on the cooling system far more than on the fuel. On a wet recirculating tower, a gas combined cycle plant consumes about 206 gallons per MWh, coal about 580 and nuclear about 601. Once-through cooling withdraws 25,000 to 50,000 gallons per MWh while consuming little in-plant. Dry cooling consumes effectively none, at the cost of reduced output on hot afternoons and higher capital cost.
What is the difference between water withdrawal and water consumption?
Withdrawal is water taken from the source; consumption is water not returned, mostly lost to evaporation. Once-through cooling withdraws enormous volumes and consumes very little, returning nearly all of it warmer. Wet recirculating towers withdraw far less and consume far more, because cooling happens by evaporation. Which number binds depends on whether your constraint is water scarcity or a permit limit on withdrawal or thermal discharge.
What is a standby charge and why does it matter?
A standby or backup charge is a utility tariff for maintaining capacity to serve you when your own generation is unavailable. It is typically billed on demand rather than energy, so you pay it whether or not you draw power. It is the most commonly overlooked cost in a captive power business case, and a project modelled without it can lose a large share of its projected saving once commissioned.
Will my captive plant keep running during a grid outage?
Only if it was designed to. Intentional islanding, meaning operating disconnected from the utility and supplying the host alone, requires transfer equipment, protection and control capable of separating cleanly and resynchronising. Many grid-parallel installations cannot do this and shut down during the outage they were bought to survive. If reliability is a driver, confirm the design supports islanding before award.
Which standards govern a plant efficiency guarantee?
ASME PTC 46, Performance Test Code on Overall Plant Performance, governs whole-plant net output and heat rate. ASME PTC 22, Performance Test Code on Gas Turbines, covers gas turbine output and heat rate. IEEE Std 762 provides the definitions that make availability figures comparable. Name the code, agree correction curves and measurement uncertainty before award, and define availability exclusions. A method agreed after commissioning is a negotiation.
Tags: Captive Power Generation Combined Heat and Power Avoided Cost Analysis Power Plant Water Use Onsite Generation
recent posts
O&M Services
15 minutes read
Writing a Power Plant O&M RFP That Gets Comparable Bids
Write a power plant O&M RFP every bidder must price the same way. Get the pricing template, data room checklist and weighted scorecard that expose eve...

EPCM Services
19 minutes read
25 Questions to Ask a Power Plant EPC Contractor Before You Sign
Most lists of questions to ask an EPC contractor stop at the question. Get why each matters, the strong answer, the red-flag reply and a weighted bid...
Gas Turbines
19 minutes read
Dual-Fuel Gas Turbines: How Gas-and-Liquid Fuel Flexibility Works
A dual-fuel gas turbine switches from natural gas to diesel at load, but most failures start in idle oil lines. Get transfer steps and coking fixes be...
Power Utilities
18 minutes read
Temporary and Bridge Power for Industrial Facilities: When and How to Use It
Planning bridge power past 12 months? Under EPA rules your generators may be stationary from day one. Check Tier 4, NSPS KKKKa and SPCC triggers befor...