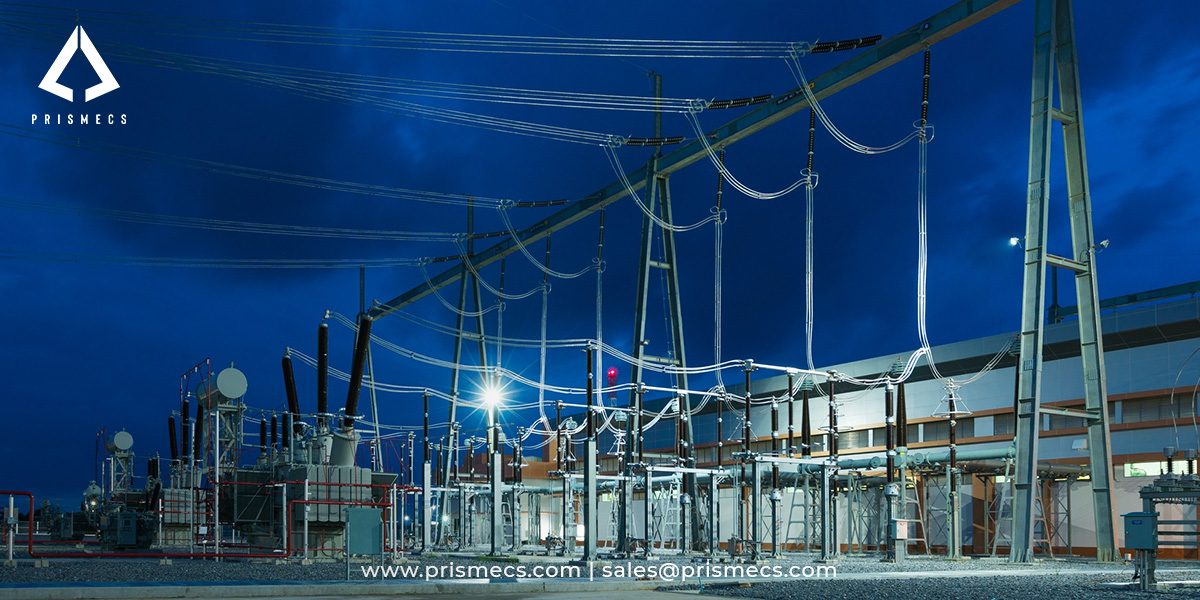
Power quality describes how closely the voltage delivered to industrial equipment matches a clean sinusoid at rated voltage and frequency, and it determines whether processes run or trip. Most unexplained equipment shutdowns in industrial facilities trace to power quality events rather than to equipment failure.
This guide covers the disturbance categories and how they are classified, why voltage sags cause the majority of process interruptions, how harmonics damage equipment, how distribution reliability is measured, what poor power quality costs, and which mitigation matches which problem.
It is written for plant managers, electrical and reliability engineers, and facilities leaders responsible for uptime at manufacturing plants, data centers, petrochemical sites, and other continuous-process operations.
What Power Quality Actually Means
Power quality is the degree to which delivered voltage supports the correct operation of connected equipment, measured against magnitude, duration, and waveform. It is distinct from reliability, which measures whether power is present at all.
The distinction matters commercially. A facility can have excellent reliability, meaning very few outages, while suffering repeated production interruptions from disturbances lasting a fraction of a second. Those events do not register as outages on a utility report, but they stop production just as effectively.
The disturbance categories
IEEE 1159, the Recommended Practice for Monitoring Electric Power Quality, classifies disturbances by magnitude, duration, and spectral content. The categories that matter most to industrial operators:
Voltage Sags: The Most Common Disturbance
Voltage sags are the most frequently reported power quality disturbance in commercial and industrial facilities, and they cause more process interruptions than any other event type. They are also the least visible, because they are too brief to appear as outages.
According to IEEE, voltage sags are short-duration reductions in RMS voltage ranging from 10% to 90% of nominal and lasting from half a cycle to one minute, and they are the most frequently reported disturbance in commercial and industrial power surveys.
What causes them
Most sags originate outside the facility. Utility fault clearing on feeder circuits is the dominant cause, where a fault elsewhere on the network depresses voltage across a wide area for the few cycles it takes protection to operate. A facility can experience sags from faults many miles away.
Internal causes matter too. Starting large motors draws high inrush current that depresses voltage on the local system, which is why sag complaints often correlate with specific equipment start sequences rather than with utility events.
IEEE 1159 classifies sags by duration as instantaneous at 0.5 to 30 cycles, momentary at 30 cycles to 3 seconds, and temporary above 3 seconds to 1 minute. The classification matters because equipment tolerance varies sharply across those ranges.
Why equipment trips
Modern equipment is more sag-sensitive than the machinery it replaced. Variable frequency drives, programmable logic controllers, and switch-mode power supplies monitor their DC bus and trip on undervoltage, often within a few cycles, to protect themselves.
The tolerance benchmark is the ITIC curve, formerly CBEMA, which defines the voltage envelope information technology equipment should ride through. Under that curve, equipment is typically expected to tolerate complete voltage loss for roughly half a cycle, around 8.3 milliseconds at 60 Hz, without disruption.
For semiconductor manufacturing, SEMI F47 specifies the voltage sag immunity that production tools must demonstrate, requiring them to ride through defined voltage profiles without interruption. The standard has influenced equipment design well beyond semiconductors, because manufacturers recognized the production losses it prevents.
Harmonics and IEEE 519 Limits
Harmonic distortion occurs when nonlinear loads draw current at integer multiples of the supply frequency, and it causes heating and equipment stress that a facility usually discovers through failures rather than measurement.
What creates harmonics
Nonlinear loads inject currents at multiples of the fundamental, typically the fifth, seventh, and eleventh harmonics on a 60 Hz system. Variable frequency drives, rectifiers, uninterruptible power supplies, and electronic ballasts are the common sources in industrial facilities.
The problem compounds with adoption. A facility that converts motors to variable frequency drives for energy efficiency can inadvertently raise its harmonic distortion above acceptable limits, creating a reliability problem while solving an energy one.
What harmonics damage
Harmonic currents flow back into the distribution system and cause additional heating in cables, transformers, and motors rated for sinusoidal current. That heating shortens insulation life, derates transformer capacity, and produces failures attributed to age rather than to distortion.
Secondary effects are equally disruptive. Harmonics can cause protective relays to operate incorrectly, interfere with communication systems sharing the building, and overload neutral conductors through triplen harmonic addition in three-phase systems.
IEEE 519-2022, the Standard for Harmonic Control in Electric Power Systems, specifies total demand distortion limits at the point of common coupling, with limits set according to the ratio of available short-circuit current to load current. Compliance is assessed at that interface, not at individual equipment.
Measuring Distribution Reliability
Distribution reliability is measured by standardized indices under IEEE 1366, which allow performance to be compared across utilities, feeders, and years. These indices describe interruptions, not power quality, which is why both must be tracked.
SAIDI, SAIFI, and CAIDI
SAIFI, the System Average Interruption Frequency Index, expresses how often the average customer experiences a sustained interruption over a year. SAIDI, the System Average Interruption Duration Index, expresses the total minutes of interruption the average customer experiences. CAIDI, the Customer Average Interruption Duration Index, expresses the average restoration time per interruption and is derived by dividing SAIDI by SAIFI.
The indices answer different questions. A feeder with high SAIFI but low CAIDI interrupts frequently and restores quickly, suggesting recurring faults. High CAIDI with low SAIFI suggests infrequent but difficult restorations, pointing at access, spares, or crew availability.
Requesting feeder-level reliability data from the serving utility is a practical step before siting sensitive processes, since these indices are reported and available, and they reveal whether a location has a history that on-site infrastructure will need to compensate for.
Standards Governing Power Quality
Power quality is governed by measurement, limit, and reliability standards working together, each addressing a distinct question.
Instrument class carries legal weight. Measurements taken with instruments meeting the IEC 61000-4-30 Class A specification provide data of defensible quality for utility disputes and insurance claims, whereas readings from non-compliant equipment are readily challenged.
What Poor Power Quality Costs
Power quality events are largely untracked in most industrial facilities, which is why their cost is systematically underestimated. Analysis published by Rockwell Automation found that power quality events can take out a process 20 to 30 times per year, costing industrial customers millions.
The cost structure explains the invisibility. A sag lasting five cycles produces no outage record, no utility notification, and no obvious cause, so the resulting trip is logged as an equipment fault. The facility then troubleshoots a drive that was functioning correctly.
Recovery cost usually exceeds the interruption itself. A continuous process that trips requires purge, restart, and requalification, and material in process is often scrapped, so a sub-second event can cost hours of production plus material loss.
Measurement is the precondition for any business case. Without power quality monitoring at the service entrance and at critical loads, a facility cannot establish event frequency, cannot correlate trips to disturbances, and cannot justify mitigation investment.
Matching Mitigation to the Problem
Power quality mitigation only works when the intervention matches the disturbance, which is why diagnosis must precede procurement. Equipment specified against the wrong problem delivers no improvement.
Two sequencing points prevent wasted capital. Capacitor banks installed for power factor correction can resonate with existing harmonics and amplify distortion, so harmonic assessment should precede capacitor installation. And equipment ride-through capability should be verified before facility-wide mitigation is purchased, since upgrading a few drive control cards is sometimes cheaper than conditioning an entire service.
How Prismecs Improves Industrial Power Quality
Prismecs engineers and delivers the electrical infrastructure that resolves power quality problems, covering distribution equipment, conditioning, storage, and on-site generation. The work sits between diagnosis and sustained improvement.
The Prismecs capability set for power quality and distribution reliability:
- Electrical infrastructure: transformers, switchgear, and distribution engineered to the facility's load profile and fault levels.
- Power conditioning and backup: UPS systems and battery energy storage supporting critical loads through sags and interruptions.
- On-site and backup generation: generation sized and specified for facilities where utility exposure cannot be engineered away.
- Distributed energy integration: for facilities where a microgrid or on-site generation is the right answer, delivered through our distributed energy capability.
- O&M: maintenance across electrical assets, so mitigation equipment performs when the disturbance arrives.
The differentiator is delivery rather than diagnosis. Automation vendors publish the analysis and sell monitoring, consultants perform audits, and instrument makers sell meters, but the transformers, switchgear, storage, and generation that actually resolve the problem come from a different party. Prismecs is that party.
Frequently Asked Questions
What is a voltage sag and why does it matter?
A voltage sag is a short-duration reduction in RMS voltage to between 10% and 90% of nominal, lasting from half a cycle to one minute. IEEE identifies sags as the most frequently reported disturbance in commercial and industrial power surveys. They matter because modern drives, PLCs, and power supplies trip on undervoltage within a few cycles, stopping processes without producing any outage record.
What causes voltage sags in industrial facilities?
The dominant cause is utility fault clearing on feeder circuits, where a fault elsewhere on the network depresses voltage across a wide area for the cycles it takes protection to operate. A facility can experience sags from faults miles away. Internally, starting large motors draws inrush current that depresses local voltage, which is why sag complaints often correlate with specific start sequences.
What limits does IEEE 519 set for harmonics?
IEEE 519-2022 specifies total demand distortion limits at the point of common coupling, with permitted levels set according to the ratio of available short-circuit current to load current. Compliance is assessed at that interface rather than at individual equipment. Harmonics arise from nonlinear loads such as variable frequency drives and rectifiers, typically at the fifth, seventh, and eleventh harmonics.
What are SAIDI, SAIFI, and CAIDI?
These are distribution reliability indices defined under IEEE 1366. SAIFI measures how often the average customer experiences a sustained interruption annually. SAIDI measures total interruption minutes experienced. CAIDI measures average restoration time per interruption, derived by dividing SAIDI by SAIFI. Together they distinguish frequent brief interruptions from infrequent lengthy ones, which point to different underlying causes.
How much do power quality problems cost industrial facilities?
Analysis published by Rockwell Automation found power quality events can take out a process 20 to 30 times per year, costing industrial customers millions. The cost is systematically underestimated because brief events produce no outage record, so resulting trips are logged as equipment faults. Recovery frequently exceeds the interruption itself, since continuous processes require purge, restart, and requalification.
How do you fix voltage sags and harmonics?
Mitigation must match the disturbance. Sags affecting critical loads are addressed with double-conversion UPS or dynamic voltage restorers, while facility-wide exposure may require feeder reconfiguration or on-site generation. Harmonics are addressed with active filters, 12-pulse or 18-pulse rectifiers, and K-rated transformers. Harmonic assessment should precede any capacitor installation, since capacitors can resonate with existing distortion.
Why Power Quality Is a Measurement Problem First
Power quality determines industrial uptime more directly than utility reliability statistics suggest, and it remains largely unmeasured in facilities that would benefit most from measuring it. The standards are established, the disturbance categories are defined, and the mitigation technologies are proven.
Facilities losing production to unexplained trips need a partner who can engineer the distribution infrastructure, specify the right conditioning for the right disturbance, and maintain it. That is the Prismecs model: electrical infrastructure delivered and supported for continuous operation.
To assess distribution infrastructure, specify power conditioning, or address recurring process interruptions, call +1 (888) 774-7632 or email sales@prismecs.com.
Tags: industrial power quality voltage sag IEEE 1159 harmonic distortion IEEE 519 SAIDI SAIFI reliability power quality mitigation
recent posts
O&M Services
15 minutes read
Writing a Power Plant O&M RFP That Gets Comparable Bids
Write a power plant O&M RFP every bidder must price the same way. Get the pricing template, data room checklist and weighted scorecard that expose eve...

EPCM Services
19 minutes read
25 Questions to Ask a Power Plant EPC Contractor Before You Sign
Most lists of questions to ask an EPC contractor stop at the question. Get why each matters, the strong answer, the red-flag reply and a weighted bid...
Gas Turbines
19 minutes read
Dual-Fuel Gas Turbines: How Gas-and-Liquid Fuel Flexibility Works
A dual-fuel gas turbine switches from natural gas to diesel at load, but most failures start in idle oil lines. Get transfer steps and coking fixes be...
Power Utilities
18 minutes read
Temporary and Bridge Power for Industrial Facilities: When and How to Use It
Planning bridge power past 12 months? Under EPA rules your generators may be stationary from day one. Check Tier 4, NSPS KKKKa and SPCC triggers befor...