A plant manager at a 300 MW combined-cycle facility in a high-solar region now faces a reality that did not exist a decade ago: the unit that ran at baseload is being asked to ramp from minimum stable load to full output in under 30 minutes, multiple times per day. The turbine was not designed for that cycle frequency. The PPA economics assumed something different.
Renewable energy integration is the process of incorporating variable renewable energy sources into existing transmission and distribution infrastructure while sustaining reliable, stable power delivery. Variable sources including wind, solar PV, and run-of-river hydro cannot be dispatched on demand. Dispatchable renewables including reservoir hydro, geothermal, and biomass generate commands like a gas turbine. That distinction determines every engineering decision that follows.
The barriers to integration today are not technology. They are the interconnection queue, the transmission gap, the permitting timeline, and market structures that have not been adapted. This article addresses each with the specificity required to make decisions, not just understand the problem.
The Grid's Baseline Logic: Why Adding Renewables Disrupts Everything
Supply and demand must balance in real time, continuously, within tolerances measured in fractions of a hertz. In North America, the nominal grid frequency is 60 Hz. A sustained drop below 59.5 Hz triggers automatic under-frequency load shedding. A rise above 60.5 Hz risks equipment damage across the network.
The dispatch stack organizes generators in merit order by marginal cost. Cheapest generators run first. Renewables with zero fuel cost now sit at the front of that queue. When wind or solar output drops, gas plants must ramp back up fast, and gas peakers running fewer annual hours see declining revenue that weakens the investment case for the backup capacity the grid still requires.
The deeper disruption is physical. Conventional synchronous generators store rotational kinetic energy in their spinning mass. This synchronous inertia buffers the grid against sudden imbalances. As synchronous machines retire and inverter-coupled renewables replace them, that buffer shrinks and the rate of change of frequency (RoCoF) during disturbance events accelerates, compressing the response window for protective relay systems.
What a High-VRE Ramp Event Looks Like in the Control Room
When a large cloud bank crosses a solar-heavy grid, the security-constrained economic dispatch (SCED) algorithm, which re-solves the dispatch optimization every five minutes in most US ISOs, detects the drop in solar output and issues revised dispatch signals to dispatchable units within the same cycle. Automatic generation control (AGC) then adjusts generator output every four seconds to track area control error (ACE).
The challenge is that SCED solves a five-minute optimization, but solar output can change by several hundred megawatts within 60 seconds during a cloud ramp event. If the ramp exceeds the committed regulation reserve, the operator must manually commit additional spinning capacity, a process that takes minutes, during which frequency deviates.
NERC Reliability Standard BAL-001-2 governs the ACE limits within which US grid operators must operate. Violations carry financial penalties and, in severe cases, reliability of event reporting obligations. VRE forecast accuracy at the 5 to 15-minute horizon is not a meteorological preference. It determines whether the SCED algorithm avoids reserve violations.
The Six Real Challenges of Renewable Energy Integration

As renewable penetration increases, power systems must address six critical challenges: maintaining grid stability, ensuring operational flexibility, expanding transmission infrastructure, integrating energy storage, modernizing forecasting and market operations, and securing long-duration backup for periods of low renewable generation. Successfully overcoming these challenges is essential to achieving a reliable, resilient, and low-carbon electricity system.
Variability and Forecasting Uncertainty
Solar generation follows a predictable diurnal arc with superimposed cloud-cover variability. The wind does not behave this way. Wind output can change hundreds of megawatts in minutes at a single site, and the correlation between adjacent sites weakens with distance in ways that resist accurate modeling.
Forecast errors have a non-linear cost relationship with penetration. A grid at 5 percent VRE absorbs a 20 percent forecast error within existing spinning reserve margins. A grid at 40 percent VRE faces a physical imbalance large enough to trigger load shedding from that same error magnitude. The NREL Western Wind and Solar Integration Study confirmed that reserve requirements grow faster than VRE penetration beyond approximately the 25 percent threshold.
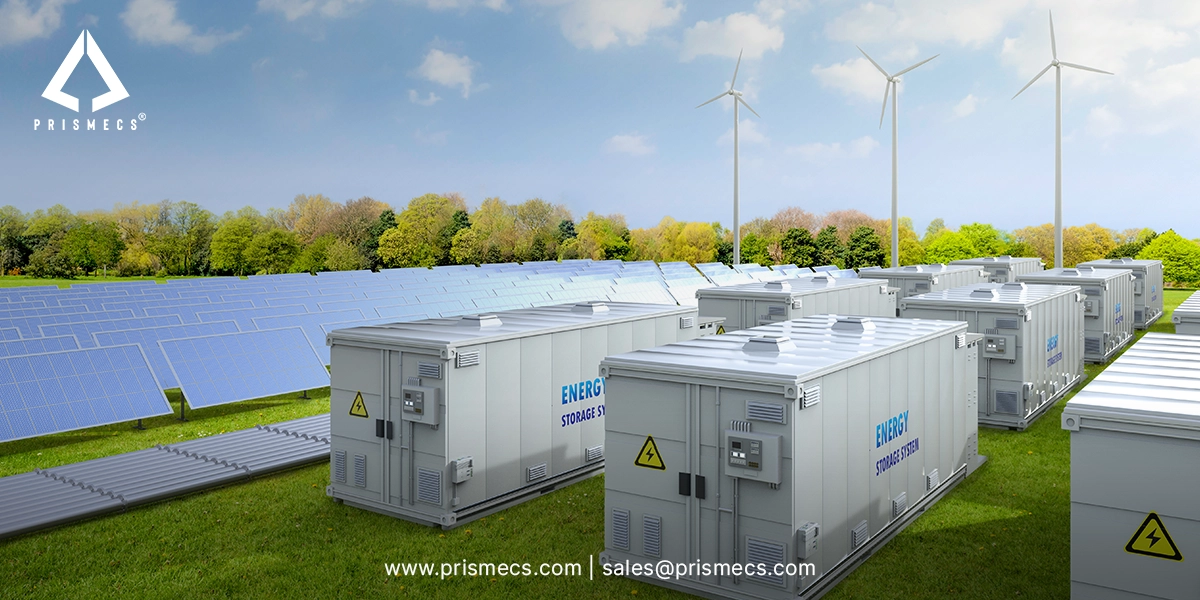
Deploying BESS alongside renewable generation reduces this exposure by decoupling generation from dispatch. The BESS absorbs forecast error before it reaches the reserve market. At high penetration levels, this co-location is operationally necessary, not supplementary.
System Inertia Loss and Frequency Stability
Standard grid-following inverters synchronize to an existing voltage and frequency reference on the network. If that reference disappears during a fault or islanding event, the inverter trips offline. It cannot establish or maintain its own voltage reference.
Grid-forming inverters operate as voltage sources rather than current sources. They establish their own frequency of reference, respond to load changes as a synchronous generator would, and provide synthetic inertia by programming control loops to emulate the mechanical swing equation of a rotating machine. IEEE Standard 2800-2022 establishes interconnection requirements for inverter-based resources and explicitly addresses grid-forming capability as a reliability-critical function.
Transmission Congestion and Geographic Mismatch
The best US wind resources are in West Texas, the Plains states, and the upper Midwest. The largest load centers are the Northeast corridor, California, and the Great Lakes. Transmission infrastructure adequate to connect to them does not exist in most corridors and takes 10 to 20 years to build.
The consequence is curtailment. ERCOT curtailed approximately 2.1 TWh of West Texas wind due to transmission congestion. Those are operating projects delivering zero grid value because the export wire was not built.
Dynamic line rating uses real-time conductor temperature and ambient conditions to increase line transfer capacity 10 to 40 percent above static ratings. EPRI studies across multiple US utilities confirmed average capacity gains of 20 to 30 percent. The technology is deployable on existing infrastructure at near-zero capital cost and is systematically underutilized across most grid regions.
The Interconnection Queue Bottleneck
The interconnection queue is the administrative process through which a new generator applies to connect to the transmission grid. Each new application enters a sequential study process. When any application in the queue changes, all studies for projects behind it must be redone.
As of 2023, median project waits times in major US grid regions exceeded five years. Project withdrawal rates exceeded 70 percent. More than seven out of ten projects that enter the queue never reach commercial operation, not due to technology failure, but due to administrative collapse.
The Duck Curve and Ramping Stress
CAISO's spring net load curve shows a deep midday trough as solar displaces conventional dispatch, followed by a steep evening ramp as solar fades and peak demand arrives.
That ramp is served primarily by gas-fired peakers and BESS that are charged during the midday surplus. The operational paradox is real: high solar penetration requires retaining or building gas peaking capacity specifically to serve the ramp. A two-hour battery system cannot serve as a four-hour evening ramp. Storage duration is a specification variable that determines whether the system works operationally, not just technically.
Permitting, Siting, and the Time-to-Build Gap
A utility-scale solar or wind project in the United States takes 8 to 12 years from initial site control to commercial operation. NEPA environmental review, state siting permits, FAA aviation lighting approvals, and local zoning variances each add months to years. Transmission projects take longer still, requiring easement negotiations with hundreds of individual landowners across multiple state jurisdictions.
Projects that engage landowners through community benefit agreements, direct revenue sharing, and genuine sitting flexibility achieve measurably faster permitting and lower legal challenge rates. This is a project to schedule optimization outcomes with direct IRR consequences, not a stakeholder of relations observation.
How the Grid Adapts: The Complete Technology Stack
The integrated technologies that enable power systems to reliably accommodate increasing levels of renewable energy. From advanced forecasting and digital grid management to energy storage, flexible generation, transmission expansion, and grid-forming inverters, each layer enhances system flexibility, stability, and resilience.
Grid-Forming Inverters: The Technology That Replaces Spinning Inertia
A grid-following inverter synchronizes reference the grid provides. A grid-forming inverter creates the reference the grid needs. In a system where 80 percent of generation is inverter-coupled, there may not be enough rotating synchronous mass to provide a stable reference for grid-following devices to track.
Grid-forming inverters implement virtual synchronous generator (VSG) control algorithms that emulate the mechanical swing equation. They respond to load changes autonomously, maintain low-voltage ride-through (LVRT) compliance during faults, and can black-start a de-energized grid segment without requiring a synchronous generator. IEEE 2800-2022 formally categorizes these capabilities within its IBR interconnection standard.
The UK National Grid ESO has published grid-forming inverter procurement frameworks for the GB system. Australia mandated the capability following the 2016 South Australia blackout. These are regulatory requirements with enforced compliance timelines, not items on a technology roadmap.
Energy Storage: Short, Medium, and Long Duration
Storage duration matters as much as storage capacity, and they are not the same specification. A 100 MW battery rated for two hours contains 200 MWh of usable energy. The same plant rated for eight hours contains 800 MWh. Treating all BESS deployments as equivalent is a specification error that produces systems adequate for today's grid and inadequate for the grid two years from now.
Short-duration BESS using lithium-ion chemistry has installed costs of approximately $150 to $280 per kWh for utility-scale systems. This technology dominates current deployments for frequency regulation, peak shaving, and duck curve management. Its operational limitation is that it cannot shift energy across days or weeks.
Medium-duration systems of 8 to 24 hours include vanadium redox flow batteries and iron-air chemistry commercialized by Form Energy. Flow batteries allow energy capacity to scale independently of power rating and offer cycle lifetimes exceeding 20,000 cycles without meaningful degradation, compared to 3,000 to 6,000 cycles for lithium-ion under daily deep cycling.
Long-duration and seasonal storage addresses Phase 5 and Phase 6 grid requirements. Pumped storage hydropower accounts for more than 90 percent of installed grid storage globally. Green hydrogen via PEM electrolysis offers near-infinite storage duration but carries round-trip efficiency of 35 to 40 percent. AA-CAES achieves approximately 70 percent round-trip efficiency, with levelized storage costs below EUR 0.10 per kWh in European project assessments.
Grid-Enhancing Technologies and Smart Grid Tools
Dynamic line rating is the lowest-cost near-term integration tool available. Real-time conductor temperature and ambient data increase line transfer capacity 10 to 40 percent above static ratings, with no new construction required. EPRI studies across multiple US utilities confirmed average capacity gains of 20 to 30 percent.
Phasor measurement units (PMUs) provide time-stamped voltage and current measurements at 30 to 120 samples per second across wide-area monitoring systems (WAMS). NERC standards PRC-002 and FAC-001 reference PMU data requirements for transmission planning. Topology optimization software using real-time network state data has reduced congestion costs 5 to 15 percent annually in documented utility deployments, without building new lines.
Demand Response and the Flexible Load Revolution
Industrial demand response is not emergency load curtailment. It is the systematic programming of large controllable loads to shift consumption in response to grid conditions, price signals, or direct dispatch instructions. Aluminum smelters, chlor-alkali plants, water treatment facilities, and data centers with thermal mass can reduce or shift load by 10 to 30 percent within minutes without disrupting production.
Virtual power plants aggregate residential solar, batteries, EV chargers, and smart thermostats into a single dispatchable resource that bids into wholesale energy and ancillary services markets. Australia's AGL VPP operates across more than 500 MW of aggregated residential assets in South Australia. FERC Order 2222 (2020) required US grid operators to allow aggregated DER to participate in all wholesale market segments, removing the primary regulatory barrier to VPP development.
Transmission Expansion and the HVDC Renaissance
HVDC transmission carries power over long distances with lower losses than HVAC beyond roughly 300 miles. More importantly for renewable integration, HVDC lines offer controllable power flow: the operator sets the transfer schedule rather than allowing AC network physics to determine it. The SunZia project connects 3,000 MW of New Mexico wind to Arizona and California load centers and is the largest transmission project built in the United States in 40 years.
VSC-HVDC technology, now standard for new offshore wind connections, supports black-start capability, reactive power compensation, and island operation without a synchronous machine reference. Europe's North Sea offshore network is transitioning from radial point-to-point HVDC links toward a multi-terminal meshed grid capable of routing power across multiple national markets simultaneously.
The Six Phases of VRE Integration: Which Stage Is Your Grid In?
The IEA's VRE integration framework categorizes grids into six phases by the annual share of electricity supplied by variable renewables. Each phase carries distinct operational challenges and requires prioritized investment in specific flexibility measures. Identifying your grid's current phase before selecting integration technologies is the single most efficient way to avoid misallocated capital.
Phase / VRE Share | Key Challenge | Priority Measures + Real-World Examples |
Phase 1 | VRE below 3% | No system-level operational impact. Static dispatch practices are unchanged. | Priority: generation capacity, not integration infrastructure. Examples: most Sub-Saharan African grids, isolated island systems. |
Phase 2 | VRE 3 to 15% | Minor ramp challenges emerge. Forecasting and scheduling upgrades are sufficient. | Priority: VRE forecasting into SCED, scheduling coordination. Examples: India eastern grids, Southeast Asia, most of Latin America. |
Phase 3 | VRE 15 to 25% | Duck curves are operationally visible. Systematic flexibility of investment is required. | Priority: demand response programs, initial BESS, gas plant ramp upgrades. Examples: MISO, Brazil Northeast. |
Phase 4 | VRE 25 to 50% | VRE meets all demand at certain hours. Grid stability challenges at low conventional generation. | Priority: grid-forming inverters, synchronous condensers, 4-hour BESS at scale, transmission expansion. Examples: Germany, Spain, ERCOT spring hours. |
Phase 5 | VRE 50 to 75% | Significant VRE surplus must be actively managed. Storage and demand response become operational necessities. | Priority: 8–24-hour storage, mandatory VPP participation, cross-border interconnection, and sector coupling. Examples: CAISO spring/fall, South Australia. |
Phase 6 | VRE above 75% | Near-total VRE dependence. Extended low-generation periods must be managed. | Priority: seasonal storage, hydrogen from surplus, extensive cross-border interconnection, dispatchable clean backup. Examples: Denmark wind, Hawaii solar target. |
A grid operator or project developer evaluating integration investments should establish their current phase before selecting technology solutions. Installing long-duration storage in a Phase 2 grid misallocates capital. Relying on demand response alone in a Phase 5 grid is operationally insufficient. The phase assessment is the investment logic anchor.
Storage Selection: Matching Duration to Grid Phase and Use Case
The storage technology options and the six-phase framework are connected by a decision logic that most integration guides omit. Choosing storage duration and chemistry based on cost alone produces systems that are correctly sized for today's grid but inadequate for the grid in two years. The framework below connects the phase assessment directly to the storage specification decision.
Grid Phase | Operational Requirement | Storage Specification Guidance |
Phase 3 | Duck curve management, frequency regulation, peak shaving | 2-to-4-hour Li-ion BESS at $150 to $280 per kWh installed. Deploy adjacent to load centers to avoid congestion charges. |
Phase 4 | Evening ramp coverage, stability support at low conventional generation | 4-to-8-hour Li-ion BESS. Grid-forming inverter compliance required per IEEE 2800-2022. Co-locate with existing substation infrastructure where possible. |
Phase 5 | Multi-day weather event buffering, surplus absorption | 8-to-24-hour flow battery or long-duration Li-ion. Vanadium redox preferred frequent deep cycling, given its 20,000-plus cycle lifespan. Evaluate electrolyzer co-location for surplus-to-hydrogen pathway. |
Phase 6 | Seasonal energy shifting, extended low-generation period management | Pumped hydro where geography permits. Hydrogen with underground cavern storage for multi-month shifting. AA-CAES as a complementary option where geology allows approximately 70 percent round-trip efficiency. |
Capacity, duration, chemistry, and sitting are interdependent variables, not independent choices. A 100 MW / 200 MWh system sited at the wrong node on a congested grid captures less value than a 50 MW / 400 MWh system sited at the point of highest curtailment risk. Owner engineering that models locational marginal pricing and curtailment probability across candidate sites before procurement begins produces materially better outcomes than technology-first specification processes.
What Renewable Energy Integration Actually Costs: A Complete Picture
The most cited integration cost figure in the literature is $2 to $5 per MWh for wind and solar, drawn from Synapse Energy's literature review and confirmed by multiple NREL integration studies. This figure is real and defensible. It also covers only one of four distinct cost dimensions that determine the total economic picture.
Cost Dimension | Current Data (2026) |
Operational balancing costs | Still roughly $2 to $5 per MWh at current penetration levels, covering incremental reserves, redispatch, and real-time market payments to manage VRE variability. This range remains broadly stable across coal- and nuclear-heavy grid types; it climbs only as VRE penetration rises sharply. |
Storage capital costs (2026) | $150 to $280 per kWh installed for 4-hour utility-scale Li-ion BESS. A 100 MW / 400 MWh system represents $60 to $112 million. Flow batteries for longer durations: $300 to $500 per kWh installed, on a declining trajectory. |
Transmission investment | Per-mile HVAC for new lines still roughly $1 to $4 million; HVDC per-mile costs range between about $1.17 million and $8.62 million based on recent proposals and regulatory filings with converter stations accounting for as much as 60% of total fixed cost on an HVDC project. |
Cost of not integrating | California curtailed more than 2.5 million MWh of solar and wind in 2022. At $30 to $50 per MWh solar LCOE, that represents $75 to $125 million in paid-for generation delivering zero grid value. Curtailment is a quantifiable cost of delayed integration investment. |
The $2 to $5 per MWh operational figure frequently appears in policy arguments that integration costs are negligible. They are negligible only at current penetration levels and only for that one cost dimension. Transmission and storage of capital requirements, and the compounding curtailment of losses from underbuilding them, represent orders of magnitude more capital commitment than the operational balancing costs alone.
The Developing-Economy Integration Challenge: Why It's a Different Problem Entirely
In most developed markets, renewable energy integration means upgrading an existing robust grid with high reliability and modern protection systems. In many developing economies, it means integrating VRE into a grid that is itself underdeveloped, operates with high technical losses, and carries legacy financial structures that actively penalize renewable additions.
Grid technical losses in developing economy systems frequently run 15 to 25 percent, compared to 3 to 6 percent in well-maintained developed grids. High losses reduce the effective benefit of every MWh generated. Aging protection and control equipment may not be compatible with the inverter-based generation characteristics of modern solar and wind plants, requiring protection system upgrades that add cost and schedule.
Prismecs project experience across Oman, Taiwan, and Switzerland reflects the operational and logistical realities of executing integration projects across different grid maturity levels and regulatory environments.
The New Load Problem: How AI Data Centers Are Reshaping Renewable Integration
Hyperscale data centers operated by AWS, Google, and Microsoft collectively consume electricity at a rate that would rank among the top ten national electricity consumers globally. Data center power demand is growing at 15 to 25 percent annually, driven by AI model training and inference workloads that require continuous, uninterruptible power at high density. This growth is concentrated in specific grid zones, frequently in regions without the transmission capacity to serve it from existing generations.
Corporate renewable energy procurement has become the largest single driver of new VRE project development in many markets. Microsoft, Google, and Amazon collectively signed more than 40 GW of renewable PPAs in 2023. The operational complexity is that data centers require 24/7 carbon-free energy, meaning renewable power must be available now of consumption, not just matched on an annual basis. A solar PPA covering annual energy consumption does not address the operational reality of a data center drawing constant load through the night.
This 24/7 requirement is driving renewed interest in nuclear power. Microsoft's agreement with Constellation Energy to restart Three-Mile Island Unit 1, completed in 2024, and Amazon's SMR capacity agreements reflect the same logic: data centers need dispatchable zero-carbon power to complement VRE rather than compete with it for grid access. Gigawatts of new 24/7 demand in specific grid zones either require new dispatchable clean generation or push integration stress onto infrastructure not designed for this load profile.
Why Prismecs for Renewable Energy Integration
Prismecs has operated TM2500 and LM2500 aeroderivative gas turbine assets in Phase 1 to Phase 3 grid environments across three continents, providing O&M continuity that keeps backup generation available during VRE ramp events and grid transition periods.
With proven expertise, an innovation-driven approach, and a strong track record in turnkey energy projects, power infrastructure, and renewable energy systems, we help businesses transition toward cleaner, more sustainable power.
Talk to a Prismecs Energy Integration Expert
Partnering with Prismecs means working with a trusted team dedicated to delivering renewable energy solutions that perform with efficiency, reliability, and long-term value. Our systems are designed to be scalable, durable, and tailored to the evolving needs of businesses and communities. Connect with us today at 1-888-774-7632 or email us at sales@prismecs.com to embark on your renewable energy journey.
Tags: grid integration challenges variable renewable energy energy storage systems grid stability and inertia power grid modernization
recent posts
O&M Services
16 minutes read
Predictive Maintenance for Power Assets: How It Works, Challenges, and Real Applications
Predictive maintenance cuts power plant downtime, but only inside the P-F window. See fault signatures, honest ROI math and false alarm traps. Read th...

Renewables
17 minutes read
Renewable Energy Integration: Challenges, Technologies, and How the Grid Adapts
Renewable energy integration breaks grids built for baseload. See how inertia loss, duck curves, and storage decide reliability, with field-proven fix...
Healthcare Power
21 minutes read
Runtime Planning for Hospital Emergency Power
Your hospital emergency power passed every test, yet runtime can still fail mid-outage. See the NFPA 110 gap auditors miss and verify your real hours...

Data Centers
11 minutes read
How to Design Backup Power Systems That Never Fail
Data centers don't lose power to dead generators. They lose it to untested transfer logic. See how to design backup power systems that hold under load...