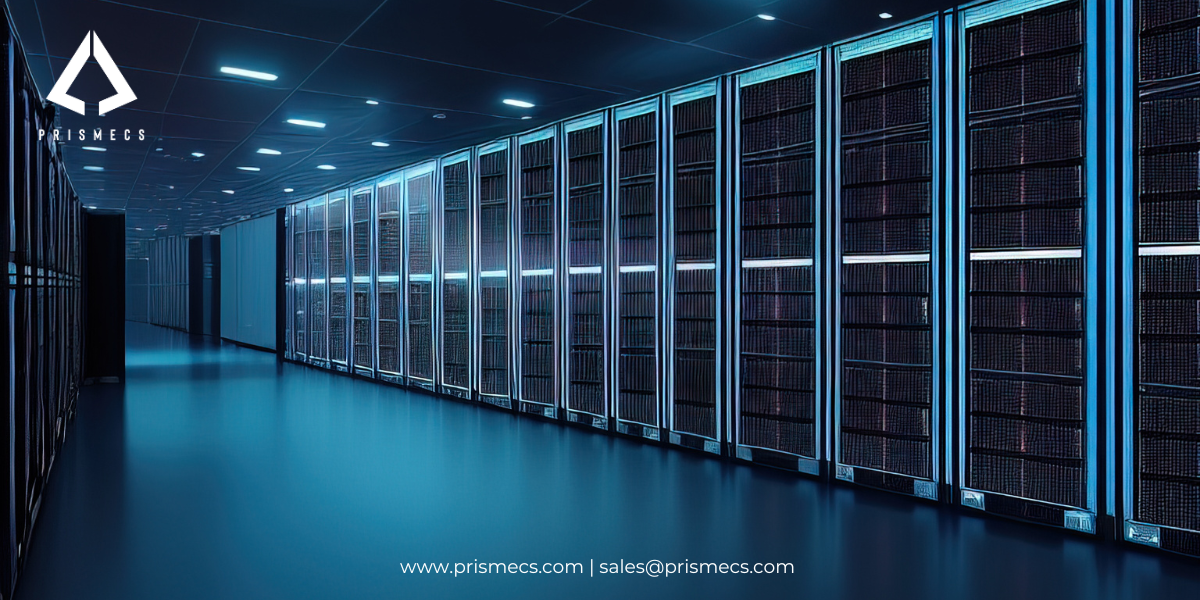
Data centre energy stopped being an efficiency problem and became a supply problem.
US data centres consumed 192 TWh in 2024, which is 4.7 percent of total US electricity, more than double their 1.9 percent share in 2018. The reference case projection for 2030 is 649 TWh, or 11.8 percent of total US electricity.
Efficiency measures still matter and they do not address what has changed. Improving Power Usage Effectiveness from 1.5 to 1.2 reduces a facility's consumption by 20 percent. It delivers no additional megawatts to a facility the utility cannot connect.
The market has already drawn that conclusion. A third of currently planned data centres are behind the meter, and of those, gas is dominant, despite renewable energy commitments across the sector.
This guide covers the real consumption figures, the grid constraint producing them, what efficiency genuinely solves, and what on-site generation requires.
The Real Number, and Why Projections Vary
US data centres consumed an estimated 192 terawatt-hours in 2024, about 4.7 percent of total US electricity.
Lawrence Berkeley National Laboratory's 2025 Update is the reference dataset. Its bottom-up model derives consumption from planned IT equipment shipments, per-device electricity use, cooling system performance simulations and facility type and location data.
That 4.7 percent share has more than doubled since 2018, when the same methodology put data centres at 76 TWh and 1.9 percent of US electricity.
The growth curve is steepening
Data centre electricity use rose 14 percent from 2023 to 2024. The LBNL update projects that rate rising to 22 percent from 2024 to 2025 and 29 percent from 2025 to 2026.
The 2030 projections
- The LBNL reference case is 649 TWh in 2030, equivalent to 11.8 percent of total US electricity, with scenarios ranging from 521 to 843 TWh, or 9.5 to 15.3 percent.
- EPRI projects 380 to 790 TWh by 2030, representing 9 to 17 percent of US electricity, with estimates roughly 60 percent higher than EPRI anticipated two years earlier.
- Globally, the IEA projects consumption rising from 415 TWh in 2024 to 945 TWh by 2030, growing at roughly 15 percent per year and outpacing every other electricity sector.
Why the forecasts disagree so widely
Modelled projections to 2030 range from 200 TWh per year to over 1,050 TWh per year. An EPRI paper found data centres could consume anywhere between 4.6 and 9.1 percent of US electricity by 2030, and the 200 TWh gap between those figures is equivalent to the consumption of almost 11 million homes.
Plan against a range, not a point estimate. The uncertainty is genuine, it stems from unresolved questions about AI chip shipments, chip operating lifetimes and server utilization, and a power strategy built on one number is built on noise.
For how AI workloads specifically are reshaping generation requirements, see our analysis of AI and data centre power needs.
Where the Demand Is Concentrated
- National averages conceal the problem. Data centre load is concentrated in a small number of states where it already dominates local electricity supply.
- Virginia, the world's largest data centre market, could see data centres consume 41 to 59 percent of state electricity by 2030, up from 25 percent today.
- Seven other states could exceed 20 percent by the end of the decade: Arizona, Indiana, Iowa, Nebraska, Nevada, Oregon and Wyoming.
Why this matters for siting
The constraint is local, not national. A national figure of 11.8 percent describes a manageable problem. A state figure of 59 percent describes a utility that cannot serve the next request regardless of what the national grid looks like.
Adding 200 to 600 TWh of new data centre load by 2030 requires new transmission, generation and distribution infrastructure in concentrated geographic clusters, which is substantially harder than adding the same load across a continent.
Outside the United States
The pattern repeats wherever data centre development concentrates. Ireland, Singapore and parts of the Netherlands have all imposed connection restrictions or moratoria in specific regions. Confirm the local position rather than the national one, because that is where the answer lives.
The Grid Constraint
- The grid cannot connect what the sector is requesting, and the queue is the measurable evidence.
- Grid interconnection queues contain over 100 GW of data centre projects seeking connection through 2030.
- PJM, MISO and CAISO together hold roughly 1,500 GW of queued generation, with average queue processing times of about five years. Data centre grid interconnection now takes up to a decade in the worst cases. One utility reported a 700 percent surge in data centre grid requests.
The three constraints behind the queue
- Transmission capacity. Serving concentrated new load requires new lines, and transmission takes years to permit and build.
- Generation availability. Announced AI capacity converts to operating load at a rate the interconnection queue directly constrains, and baseload retirements are reducing available capacity while demand accelerates.
- Equipment lead times. Local utilities face transformer shortages and substation upgrade backlogs. Power transformers, breakers and large conductors currently run 90 to 130 weeks, roughly two to two and a half years.
If your queue position slips
It commonly does, through study restudies triggered by projects ahead of you withdrawing or changing. A queue position is not a connection date, and a project whose financing assumes one is carrying a timing risk nobody has priced.
What Efficiency Solves, and What It Does Not
Power Usage Effectiveness improvements reduce consumption and cost. They do not create connection capacity.
PUE is total facility power divided by power delivered to IT equipment. A PUE of 1.5 means half a watt of overhead for every watt of computing. The industry average sits around 1.58, while hyperscale operators report fleet-wide figures near 1.10.
The arithmetic, stated plainly
- A facility improving PUE from 1.5 to 1.2 reduces total consumption by 20 percent. On a 40 MW IT load, that is a drop from 60 MW to 48 MW of total facility demand.
- That is a real and worthwhile saving, and it is not additional capacity. A facility needing 100 MW that can only connect 60 MW does not solve the gap with efficiency, because efficiency reduces what it draws rather than increasing what it can get.
The three pillars
Power, cooling and connectivity are the three foundations of any data centre, and each must be engineered as part of an integrated system rather than managed independently. Failures in one cascade immediately into the others.
Efficiency work touches cooling and power distribution. The supply question sits upstream of all three.
Water Usage Effectiveness
WUE is the equivalent water metric, and it matters increasingly where cooling water is constrained or regulated. Roughly 80 percent of a data center's total water footprint is indirect, consumed upstream by the power plants generating its electricity.
The electrical measures that genuinely reduce load
- Power distribution losses. Transformer and distribution efficiency, and losses in the UPS chain.
- Intelligent power distribution units. PDUs that monitor and control power at individual device level, allowing precise energy management and identifying waste that aggregate metering hides.
- Energy monitoring with real-time measurement, which is the prerequisite for any of it. ISO 50001 provides the energy management system framework.
- For PUE benchmarks, rack density thresholds and the shell specification that determines them, see our guide to powered shell data centers.
Cooling as a Power Load
Cooling can account for 40 percent of a data center's energy usage, which makes it the largest single target for efficiency work and a major component of the facility's electrical load.
- Hot and cold aisle containment physically separates supply and return air streams, preventing mixing and reducing the cooling capacity required to hold inlet temperature. It is the lowest-cost improvement available on most existing facilities.
- Free cooling and economizers use ambient conditions to reduce or eliminate mechanical cooling. They are the primary route to a PUE below 1.2 and their effectiveness depends entirely on climate.
- Liquid cooling moves heat exchange closer to the processor, handling densities that air cannot. It is not an efficiency option at high rack density; it is the only option.
The density threshold
Air cooling runs out at roughly 40 to 50 kW per rack, and the constraint is airflow rather than any thermal limit. Current AI racks draw 125 to 140 kW and ship liquid-cooled by design.
ASHRAE Technical Committee 9.9 publishes the thermal guidelines, recommending 18 to 27°C at equipment inlet for air-cooled classes A1 through A4, with a narrower 18 to 22°C for high-density liquid-cooled class H1.
If the site has no water
Evaporative and water-cooled systems are off the table, which pushes the design toward air-cooled chillers or dry coolers at an efficiency penalty. Establish water availability before selecting the cooling architecture, because retrofitting that decision is substantially more expensive than making it correctly.
For cooling technology detail and the kW per rack thresholds, see our guide to powered shell data centers.
Renewables, RECs and What They Actually Deliver
Renewable procurement reduces reported emissions. Whether it delivers power to the facility depends entirely on the structure.
- On-site generation physically supplies the facility. Solar and wind at data centre scale rarely cover a continuous load alone, but they reduce grid draw and can be paired with storage and firm generation.
- A power purchase agreement contracts for renewable energy delivered to the grid, usually elsewhere. It changes the emissions accounting and does not change what arrives at the meter.
- Renewable energy credits represent the environmental attributes of renewable generation, purchased separately from the electricity itself. They offset reported emissions and deliver no physical power.
The distinction that matters operationally
None of the three solves a connection constraint. A facility that cannot connect 100 MW cannot connect it with a REC portfolio.
Renewable procurement is a carbon strategy. On-site firm generation is a capacity strategy. They answer different questions and are frequently conflated in the same sentence.
Additionality and reporting
Where corporate reporting commitments depend on renewable procurement, the structure determines whether the claim survives scrutiny. Re-cost the commitment against current power economics rather than assuming the previous plan still delivers it.
For the wider green data centre picture, see our guide to investing in green data centers.
Behind the Meter: What the Market Has Already Decided
- A third of currently planned data centres are behind the meter, and of those, gas is dominant despite renewable energy pledges across the sector.
- Behind-the-meter generation means power produced on the customer's side of the utility connection, serving the facility directly rather than through the grid.
- That is not a forecast. It is a revealed preference from operators who have run the connection arithmetic and concluded they cannot wait.
Why operators are choosing it
Several large-load customers now co-locate on-site generation and storage specifically to begin operations before transmission infrastructure upgrades are complete.
The logic is simple. A facility earning revenue on partial on-site capacity in eighteen months is worth more than a facility earning nothing while it waits five years for a connection.
Natural gas is expected to dominate new US power generation for AI in the near term, because it is dispatchable, deployable on the required timescale, and available at the scale these loads require.
What behind-the-meter does not remove
The permitting obligation, the fuel supply question, the emissions position, and the requirement to operate a power plant. It moves the constraint from the utility to you, which is an improvement only if you can carry it.
If the grid cannot connect you at all
On-site generation becomes the primary supply rather than a supplement, which changes the redundancy requirement entirely. A facility with no grid connection has no fallback, and the generation plant inherits the availability obligation the utility would otherwise have carried.
Bridge Then Permanent
The deployment pattern operators are using is temporary capacity first, permanent capacity second, with the two overlapping.
Bridge power is fast-deployable generation that serves the facility while permanent supply is arranged, whether that permanent supply is a utility connection or a purpose-built plant.
Why it works commercially
It separates the revenue date from the connection date. A facility that can energize partial capacity in months rather than years begins earning while the permanent solution proceeds on its own timeline.
What bridge capacity looks like
Mobile and modular gas turbine units, containerized reciprocating engine plant, and battery storage for ride-through and peak management. All three are transportable, all three deploy in months rather than years, and all three can be redeployed or sold afterwards.
Phasing
Match generation capacity to the IT load ramp rather than to the ultimate design. Most facilities fill over years, and generation sized for day-one full load runs at part load for most of that period, which costs efficiency and capital simultaneously.
Financing
Bridge capacity is frequently rentable or leasable rather than purchased, which keeps it off the balance sheet and matches the cost to the period it is needed. That structure is worth exploring before committing capital to equipment you will own for twenty years and need for three.
Technology Options for On-Site Power
Four technologies serve data centre on-site generation, and the choice turns on capacity, deployment speed and fuel availability.
Turbine or engine
Gas turbines deliver more power per unit in less space and fewer maintenance events. Reciprocating engines deliver higher simple-cycle efficiency below roughly 50 MW, hold part-load efficiency far better, and offer N+1 redundancy across multiple units.
For a data centre load that grows in steps and runs continuously, both are credible and the answer turns on block size, land and fuel.
Storage
Battery storage is not generation and it is essential alongside it. It covers the seconds between a grid event and generation reaching load, which is precisely the window a data centre cannot tolerate.
If fuel supply is constrained
Gas availability and pipeline capacity are site-specific and frequently the binding constraint on behind-the-meter gas generation. Confirm the gas connection before specifying the generation, because it has its own lead time and its own queue.
Staffing
On-site generation means operating a power plant. That is a department or a contract, not an addition to facilities management, and it should be resourced before the equipment arrives rather than after.
Emissions and Permitting
On-site generation carries an air permitting obligation that grid supply does not, and it is frequently the longest item on the schedule.
40 CFR Part 60 Subpart KKKKa applies to stationary combustion turbines constructed, modified or reconstructed after 13 December 2024, setting NOx limits by turbine category and requiring selective catalytic reduction for units above 850 MMBtu/hr heat input operating above a 45 percent capacity factor.
Stationary reciprocating internal combustion engines fall under a different subpart with its own limits and testing requirements.
Local air permitting
State and local permitting is usually the binding constraint rather than the federal standard, particularly in non-attainment areas and in the states where data centre development is most concentrated.
Start the air permit process in parallel with site acquisition, not after equipment selection, because it determines what equipment is permissible.
If emissions limits tighten
A configuration that stays below a control technology threshold is sometimes worth choosing even at an efficiency penalty, because the avoided capital and operating cost of the control system can exceed the efficiency gain. That is a concept-stage decision.
What to Specify
A data centre power strategy is reviewable only if it states the supply position honestly before it states the efficiency target.
- Confirmed grid capacity, in MW, with the utility service agreement status, the energization date and whether the capacity is contracted or queued.
- The IT load ramp, by phase and date, because generation sized for the ultimate load runs at part load for years.
- Design PUE, with the measurement boundary and the conditions it assumes.
- Design rack density in kW per rack, which determines the cooling architecture and therefore a large part of the electrical load.
- On-site generation capacity and configuration, with the redundancy level and the fuel supply arrangement.
- Air permit status, named by permit type and authority.
Evaluating a proposal
Ask whether the grid capacity is contracted or queued, and for the documentary evidence. Ask what the facility does if the connection date slips twelve months. Ask how generation capacity is phased against the IT ramp. Ask who operates the generation plant.
Commissioning
Power infrastructure is proven at commissioning, not at design. For what each level of testing proves and why Level 5 integrated systems testing is the one that gets compressed, see our guide to data center commissioning.
Insurance
Insurers assess power system design, redundancy configuration and commissioning evidence when pricing data centre risk. A documented reliability case including on-site generation is underwriting evidence, and an undocumented one is a question at renewal.
How Requirements Differ by Facility Type
Four data centre classifications, and the supply question lands differently on each.
- Hyperscale. Built by the largest operators for cloud and AI workloads, in blocks of hundreds of megawatts. These are the facilities driving the queue, and they are the most likely to go behind the meter because they have the balance sheet and the urgency.
- Colocation. Lease space and power to multiple tenants. Power availability is the product, which makes secured capacity a sales asset rather than an operating input.
- Enterprise. Owned and operated by a single organization for internal computing. Smaller, usually grid-connected, and the efficiency measures matter relatively more because the supply constraint bites later.
- Edge. Deployed close to end users to reduce latency. Small individual loads, distributed sites, and the power question is about reliability and remote operation rather than capacity.
- AI training facilities sit across hyperscale and colocation and behave differently from both. Very high rack density, liquid cooling by default, and load profiles that are far less steady than conventional cloud workloads.
What Prismecs Does
Prismecs delivers on-site and bridge power generation for industrial and mission-critical facilities, covering equipment supply, engineering, installation, commissioning and operations.
Delivered project scope includes eight TM2500 dual-fuel units totaling 260 MW at Birr, Switzerland, built as a fast-track plant online in six months on a compact site with a new 220 kV interconnection and engineered noise controls; four TM2500 units totaling 110 MW at Duqm, Oman, kept grid-ready with resident O&M crews, CMMS and parts support; an LM2500XPRESS plant at Miaoli, Taiwan delivered in ten months; DC-coupled battery energy storage for solar and hybrid applications; and owner's engineering on a 7 MW, 28 MWh battery storage system including the utility interconnection application.
Birr is the directly relevant reference. Two hundred and sixty megawatts, a new 220 kV interconnection, engineered noise controls on a compact site, six months from award to operation. That is the same problem a behind-the-meter data centre faces, solved in a different industry.
Capability spans distributed energy solutions for on-site generation, microgrids and storage, power generation asset services for the equipment, EPCM services for project delivery, I&C services for electrical systems, controls and commissioning, O&M services for the operating phase, ready-to-ship equipment inventory for generators and transformers, owner's engineering for independent review, and technology and consulting for options analysis. Sector context is on the data centers page.
One scope boundary worth stating. Prismecs supplies power infrastructure. Server virtualization, workload management and building certification are different disciplines with different providers.
Apply this article's criteria to any proposal, including ours. Ask whether the grid capacity in the plan is contracted or queued. Ask what the facility does if the connection slips a year. Ask how generation is phased against the IT ramp. Ask who operates the plant once it is built.
To discuss data centre power availability, on-site generation or bridge capacity, send your target capacity in MW, site location and grid connection status, IT load ramp by phase, design rack density and required energization date to sales@prismecs.com or call +1 (888) 774-7632.
Frequently Asked Questions
How much electricity do data centers actually use?
US data centres consumed an estimated 192 terawatt-hours in 2024, about 4.7 percent of total US electricity, according to Lawrence Berkeley National Laboratory's 2025 Update. That share has more than doubled since 2018, when the same methodology put data centres at 76 TWh and 1.9 percent. Globally, the IEA puts consumption at 415 TWh in 2024, rising at roughly 15 percent a year.
What will data center electricity consumption be in 2030?
Lawrence Berkeley National Laboratory's reference case projects 649 TWh in 2030, equivalent to 11.8 percent of total US electricity, with scenario ranges from 521 to 843 TWh, or 9.5 to 15.3 percent. EPRI projects 380 to 790 TWh, representing 9 to 17 percent. Globally the IEA projects 945 TWh by 2030, up from 415 TWh in 2024.
Why do data center energy forecasts vary so much?
Because the underlying assumptions are unresolved. Modelled projections to 2030 range from 200 TWh per year to over 1,050 TWh per year, driven by uncertainty about AI chip shipment volumes, chip operating lifetimes and server utilisation rates. One EPRI paper found a range of 4.6 to 9.1 percent of US electricity by 2030, a 200 TWh spread equivalent to almost 11 million homes. Plan against a range.
Where is data center electricity demand concentrated?
In a small number of states where it already dominates local supply. Virginia could see data centres consume 41 to 59 percent of state electricity by 2030, up from 25 percent today. Seven other states could exceed 20 percent: Arizona, Indiana, Iowa, Nebraska, Nevada, Oregon and Wyoming. The constraint is local rather than national, which is why national averages are misleading for siting decisions.
How long does data center grid interconnection take?
Up to a decade in the worst cases, with average queue processing times around five years. Grid interconnection queues contain over 100 GW of data centre projects seeking connection through 2030, and PJM, MISO and CAISO together hold roughly 1,500 GW of queued generation. Local utilities additionally face transformer shortages and substation upgrade backlogs, with power transformers running 90 to 130 weeks.
Does improving PUE solve a capacity shortage?
No. Power Usage Effectiveness improvements reduce consumption and cost, not connection capacity. Improving PUE from 1.5 to 1.2 reduces total facility consumption by 20 percent, taking a 40 MW IT load from 60 MW total demand to 48 MW. That is a real saving. A facility needing 100 MW that can only connect 60 MW does not close the gap with efficiency, because efficiency reduces draw rather than increasing supply.
What is a good PUE and what does the industry average?
The industry average sits around 1.58, while hyperscale operators report fleet-wide figures near 1.10. Below 1.4 is good for a conventional enterprise facility, and below 1.2 is excellent and typically requires free cooling or liquid cooling. PUE is total facility power divided by power delivered to IT equipment, so a PUE of 1.5 means half a watt of overhead per watt of computing.
What share of data center energy goes to cooling?
Cooling can account for 40 percent of a data centre's energy usage, which makes it the largest single target for efficiency work and a major component of the electrical load. Hot and cold aisle containment is the lowest-cost improvement on most existing facilities. Free cooling and economisers are the primary route to a PUE below 1.2, and their effectiveness depends entirely on local climate.
At what rack density does air cooling stop working?
Around 40 to 50 kW per rack, and the constraint is airflow rather than any thermal limit. Current AI racks draw 125 to 140 kW and ship liquid-cooled by design. ASHRAE Technical Committee 9.9 recommends 18 to 27°C at equipment inlet for air-cooled classes A1 through A4, with a narrower 18 to 22°C for high-density liquid-cooled class H1.
What does behind-the-meter generation mean for a data center?
Power produced on the customer's side of the utility connection, serving the facility directly rather than through the grid. A third of currently planned data centres are behind the meter, and of those, gas is dominant despite renewable energy pledges. Several large-load customers now co-locate on-site generation and storage specifically to begin operations before transmission infrastructure upgrades are complete.
Do renewable energy credits solve a power supply problem?
No. Renewable energy credits represent the environmental attributes of renewable generation, purchased separately from the electricity itself, and deliver no physical power to the facility. A power purchase agreement contracts for renewable energy delivered to the grid, usually elsewhere. Both change emissions accounting rather than what arrives at the meter. Renewable procurement is a carbon strategy; on-site firm generation is a capacity strategy.
What is bridge power and why are operators using it?
Fast-deployable generation serving a facility while permanent supply is arranged, whether that permanent supply is a utility connection or a purpose-built plant. It separates the revenue date from the connection date, letting a facility energise partial capacity in months rather than years. Mobile gas turbine units, containerised reciprocating engines and battery storage all deploy on that timescale and can be redeployed afterwards.
Which generation technology suits data center on-site power?
Aeroderivative gas turbines for blocks above roughly 20 MW where gas is available, delivering more power per unit in less space with fewer maintenance events. Reciprocating engines for smaller blocks and variable load, with higher simple-cycle efficiency below 50 MW and N+1 redundancy across units. Battery storage alongside either, covering the seconds between a grid event and generation reaching load.
What emissions rules apply to on-site data center generation?
40 CFR Part 60 Subpart KKKKa applies to stationary combustion turbines constructed, modified or reconstructed after 13 December 2024, setting NOx limits by category and requiring selective catalytic reduction above 850 MMBtu/hr at over 45 percent capacity factor. Reciprocating engines fall under a different subpart. State and local permitting is usually the binding constraint rather than the federal standard, particularly in non-attainment areas.
Tags: Data Center Power Behind-the-Meter Generation Grid Interconnection PUE On-Site Power
recent posts
Power Utilities
18 minutes read
Temporary and Bridge Power for Industrial Facilities: When and How to Use It
Planning bridge power past 12 months? Under EPA rules your generators may be stationary from day one. Check Tier 4, NSPS KKKKa and SPCC triggers befor...
Power Utilities
16 minutes read
What Is a Mobile Gas Turbine Power Plant? TM2500-Class Units Explained
A mobile gas turbine power plant is a transportable power generation system designed to add electrical capacity faster than a conventional permanent p...
Power Utilities
20 minutes read
Fast-Track Power Plants Deployment: How to Reach Speed to Power in Under 12 Months
Fast-track power plant deployment can hit first power in weeks. See real TM2500 timelines from permitting to COD, proven in Oman and Taiwan. Plan your...

O&M Services
11 minutes read
Gas Turbine Outage Planning: Schedule, Scope Rules, and Checklist
Gas turbine outage planning starts 18 months out. Get the T-minus schedule, scope freeze rules, parts readiness gates and checklist. Talk to a Prismec...